Food Transportation Moves Carbon from Farms to Markets

|
|
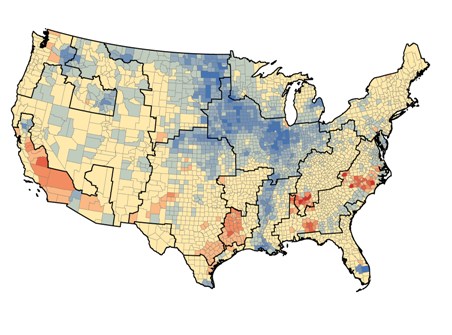
Based on U.S. crop production, scientists determined which American regions are carbon sinks, or those that take in more carbon than release it, and carbon sources, or those that release more carbon than they take in. Their calculations showed that the most agriculturally active regions, shown in blue, are carbon sinks while the regions with larger populations, shown in red, are carbon sources.
|
Today, farming often involves transporting crops long distances so consumers from Maine to California can enjoy Midwest corn, Northwest cherries and other produce when they are out of season locally. But it isn't just the fossil fuel needed to move food that contributes to agriculture's carbon footprint.
New research published in the journal Biogeosciences provides a detailed account of how carbon naturally flows into and out of crops themselves as they grow, are harvested and are then eaten far from where they're grown. The paper shows how regions that depend on others to grow their food end up releasing the carbon that comes with those crops into the atmosphere.
"Until recently, climate models have assumed that the carbon taken up by crops is put back into nature at the same place crops are grown," said the paper's lead author, environmental scientist Tristram West of the Department of Energy's Pacific Northwest National Laboratory. "Our research provides a more accurate account of carbon in crops by considering the mobile nature of today's agriculture."
West works out of the Joint Global Change Research Institute, a partnership between PNNL and the University of Maryland. His co-authors are researchers at PNNL, Oak Ridge National Laboratory and Colorado State University.
During photosynthesis, plants take in carbon dioxide and convert it into carbon-based sugars needed to grow and live. When a plant dies, it decomposes and releases carbon dioxide back into the atmosphere. After eating plants, animals and humans release the plants' carbon as either carbon dioxide while breathing or as methane during digestion.
But the geography of this natural carbon cycle has shifted with the rise of commercial agriculture. Crops are harvested and shipped far away from where they're grown, instead of being consumed nearby. As a result, agriculturally active regions take in large amounts of carbon as crops grow. And regions with larger populations that consume those crops release the carbon.
The result is nearly net zero for carbon, with about the same amount of carbon being taken in as is released at the end. But the difference is where the carbon ends up. That geography matters for those who track every bit of carbon on Earth in an effort to estimate the potential impacts of greenhouse gases.
Agricultural carbon is currently tracked through two means: Towers placed in farm fields that are equipped with carbon dioxide sensors, and computer models that crunch data to generate estimates of carbon movement between land and the atmosphere. But neither method accounts for crops releasing carbon in areas other than where they were grown.To more accurately reflect the carbon reality of today's agricultural crops, West and his co-authors combed through extensive data collected by various government agencies such as the Department of Agriculture, the U.S. Census Bureau and the Environmental Protection Agency.
Looking at 17 crops - including corn, soybeans, wheat and cotton - that make up 99 percent of total U.S. crop production, the researchers calculated the carbon content of harvested crops by county for each year from 2000 to 2008.
Next they used population numbers and data on human food intake to estimate, by age and gender, how much carbon from crops humans consume. On the flip side, the co-authors also calculated how much carbon humans release when they exhale, excrete and release flatulence. They did the same analysis on livestock and pets.
But not all food makes it to the dinner table. The researchers accounted for the crops that are lost due to spoilage or during processing, which ranges from 29 percent of collected dairy to as much as 57 percent of harvested vegetables. Beyond food, they determined the amount of carbon that goes into plant-based products such as fabric, cigarettes and biofuels. And they noted how much grain is stored for future use and the crops that are exported overseas.
Combining all these calculations, the researchers developed a national crop carbon budget. Theoretically, all the carbon inputs should equal the carbon outputs from year to year. The researchers came very close, with no more than 6.1 percent of the initial carbon missing from their end calculations. This indicated that the team had accounted for the vast majority of the carbon from America's harvested crops.
The team found overall that the crops take in — and later return — about 37 percent of the U.S.'s total annual carbon dioxide emissions, but that amount varies by region. Carbon sinks, or areas that take in more carbon than release it, were found in the agriculturally active regions of the Midwest, Great Plains and lands along the southern half of the Mississippi River. Regions with larger populations and less agriculture were found to be carbon sources, or areas that release more carbon than they take in. The calculations indicated the Northeast, Southeast and much of the Western U.S. and Gulf Coast were carbon sources. The remaining regions — the western interior and south-central U.S. — flip-flopped between being minor carbon sinks or sources, depending on the year.
Next, West would like his team's methods applied to forestry, which also involves the movement of carbon-containing products from one locale to another. Comprehensive carbon calculations for agriculture and forestry could be used in connection with previous carbon estimates that were based on carbon dioxide sensor towers or carbon computer models.
"These calculations substantially improve what we know about the movement of carbon in agriculture," West said. "Reliable, comprehensive data like this can better inform policies aimed at managing carbon dioxide emissions."
This research was funded by NASA through the North American Carbon Program.