The Accuracy of Groundwater Sampling
- By Samuel W. Butcher, Lauren M. McKinlay
- May 21, 2010
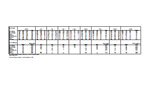
Click to enlarge table (PDF).
Most sampling events are conducted by one party and use one sampling procedure and one laboratory for sample analyses. Recently three consultants completed a three-way split sampling program: one sampling procedure was used to fill containers in a random order for three consultants sending their samples to three independent laboratories. The results showed surprisingly disparate results while duplicate sample results analyzed by the same laboratory and individual laboratory QA/QC showed acceptable levels of precision and accuracy.
The collection and analysis of these samples is a reminder that sampling the environment is complex and in some cases not fully understood. Care must be exercised when drawing conclusions that presume a detailed and complete understanding of a complex system (i.e., the environment) based on the results of data.
As part of a lawsuit, three consultants sought to accurately and precisely determine the nature and extent of gasoline contaminants in groundwater. Though representing different parties in the lawsuit, the three consultants recognized the value in developing a data set that all parties would share and use. Working together, the three consultants (Consultant A, Consultant B and Consultant C) developed a groundwater sampling plan to sample 15 groundwater observation wells at the site for multiple analyses. This article presents and analyzes the sampling procedure and results of one laboratory analysis of groundwater collected from nine groundwater observation wells.
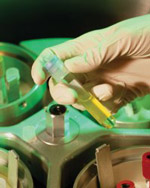
Consultant A was assigned the role of purging each well using low-flow techniques with a peristaltic pump until geochemical parameters of the purged water stabilized. Once stable, Consultant A placed groundwater samples into sample containers appropriate for analysis (preserved 40 milliliter VOA vials). Independent state-certified laboratories (Laboratory A, Laboratory B and Laboratory C) provided the sample containers to Consultant A, Consultant B and Consultant C, respectively. All consultants were on hand to inspect and document the work completed by Consultant A.
Consultant A filled sample containers in a manner intended to avoid the potential bias associated with possible changes in groundwater contaminant concentrations during groundwater purging. At each location, Consultant A filled nine containers, three from each laboratory in a rotating order such that vials from Laboratory A might be filled first, fourth and seventh while vials from Laboratory B might be filled second, fifth and eighth and Laboratory C third, sixth and ninth. The order that vials were filled changed from well to well. The three vial containers collected for each consultant constituted one sample, therefore, a total of three samples were collected from each groundwater observation well for laboratory analysis.
Once filled, Consultants A, B and C collected the vials and placed them into coolers for shipment under chain of custody to the laboratories. Consultants A, B and C delivered samples to the respective laboratories on the same day that the samples were collected or on the following day.
Each laboratory used a method of analysis developed by the Massachusetts Department of Environmental Protection (DEP) to determine the concentration of gasoline constituents. The Volatile Petroleum Hydrocarbon or VPH method is a purge and trap, gas chromatograph, mass spectrometer method that uses a photoionization detector and flame ionization detector in series. It quantifies the concentration of both individual compounds (benzene, toluene, ethylbenzene, xylenes, naphthalene and MtBE) and carbon chains (C5-C8 aliphatics, C9-C12 aliphatics and C-9 to C-10 aromatics). The consultants selected VPH in part because it was acceptable to all three consultant/laboratory teams and is widely used in Massachusetts, but also because it is the method preferred by state regulators.
The three laboratories analyzed the groundwater samples provided by the three consultants. The laboratories also analyzed QA/QC samples including a field duplicate, trip blanks, and laboratory duplicates. Additional field duplicates, trip blanks, matrix spikes and matrix spike duplicates were also analyzed as QA/QC samples for other analyses not discussed in detail in this article. Each laboratory provided reports to their respective consultants, who, in turn, circulated the reports among the other two consultants. In the end, everybody received everybody else’s data, including the results and all QA/QC backup information.
Review of information provided by the three laboratories indicates that all three laboratories met acceptable QA/QC standards when their data was viewed in isolation. For example, for each lab, all analyses were performed within the appropriate holding time and all samples were received in good condition and with the appropriate preservatives. Analytical reports show surrogate recoveries for all samples well within acceptable criteria. Reported concentrations of duplicate samples were within 10 percent for all compounds, with the majority of the compounds being within 5 percent. Trip blanks showed no evidence of cross contamination as no compounds were detected above reportable detection limits. Percent recovery of laboratory control samples (LCS) and laboratory control duplicate samples (LCDS) were within 5 percent and the relative percent difference between the LCS and LCDS samples also was within 5 percent. In short, if one were to evaluate the sampling and analysis effort based on only one laboratory report, he or she would likely conclude that the sampling effort successfully measured contaminant concentrations in groundwater with both great accuracy and precision.
To determine the accuracy between the three laboratories, the percent differences between the three samples collected from the same groundwater observation well and analyzed by three distinct laboratories were calculated. The percent differences were also calculated for thee duplicate samples where the original sample and duplicate sample were both analyzed by the same laboratory. The following formulas were used:
D = S / M x 100%
S = √[∑(X-M)2 ] / (n-1)
Standard Deviation =
D = Percent Difference
S = Standard Deviation
X = Individual Result
M = Mean of all Results
n = Sample Size
The results among the three laboratories did not correlate well when compared to one another, while the results for the duplicate samples analyzed by the same laboratory correlated within 10 percent (see the Table). Not only do the results among the three laboratories differ significantly, but the results appear to defy a straightforward explanation as to why such a disparity exists. For example:
- In many cases two laboratories report similar results while the third laboratory’s results are inconsistent. Such a result might be attributed to laboratory error or a slug of contaminant entering the sample containers. Such a discrepancy also might be attributed to improper handling of the samples between collection and analysis. However, if this were the case, one would expect all of the contaminants associated with that sample to be inconsistent. This was not observed.
- If the laboratory method were unable to accurately detect certain compounds, then one might expect the relative percent difference among the compounds to vary in a consistent manner; however, this was not observed.
- We noted a high difference in reporting among laboratories for both relatively clean samples and relatively contaminated samples. Any potential difference in the true concentration of contaminants might be exaggerated when diluting more contaminated samples but would not be expected for relatively uncontaminated samples that do not require dilution.
In collecting samples for analysis, we attempt to ensure that the contaminant concentration present in the media being sampled (for example groundwater) is accurately represented by the number we see in the laboratory report. Through understanding the limitations of sampling methods (for example, bailers versus peristaltic pumps versus bladder pumps), proper purging of wells (for example, stabilization of geochemical parameters) and standardization of handling and laboratory methods, we minimize the likelihood of spurious results. In 2005, DEP completed an extensive assessment to determine whether laboratories were able to accurately analyze water and soil samples. In this double-blind investigation, an independent contract laboratory spiked soil and water samples with a known concentration of a known contaminant. These samples were then analyzed by 20 laboratories in the state using the same methods. The results are encouraging as all labs reported results within 10 percent of the actual concentration.
But environmental samples are not prepared in a laboratory and are complex mixtures of naturally occurring elements and compounds. Environmental samples contain sediment and, despite our best efforts, change from the time they are removed from the environment to the time they are analyzed. This investigation reminds us that we must not be lulled into a sense that what we see in the laboratory report is actually what is going on in the Earth, as it might not be what it seems.
About the Authors
Samuel W. Butcher is a Licensed Site Professional and Professional Geologist at Goldman Environmental Consultants in Braintree, Mass.
Lauren M. McKinlay is a Certified Hazardous Materials Manager and Geologist at Goldman Environmental Consultants in Braintree, Mass.